Performance debugging with Spector.JS
WebXR Performance debugging with Spector.JS
Hello Coders! 👩💻 Today, I want to talk about a tool I’ve been using for a while now. WebXR is revolutionizing the way we think about virtual and augmented reality in web applications, but it’s not without its challenges. And when it comes to performance optimization, there’s one tool that has caught my attention - Spector.JS. So buckle up as we embark on this exciting journey of dissecting and optimizing WebXR using Spector.JS!
What is Spector.JS? 🤔
Spector.JS can be used as a browser extension and as a tool inside your application. It helps you debug and optimize WebGL and WebXR applications by capturing and analyzing individual frames of your application. It provides detailed insights into the underlying rendering process, making it easier for you to identify bottlenecks or issues affecting your app’s performance. It’s an invaluable tool for anyone working with 3D graphics on the web, especially when dealing with complex scenes and shaders.
Getting Started with Spector.JS ⚙️
Personally I mainly use the browser extension, so I’ll focus on that first. To get going you’ll need to install the Spector.JS browser extension, which is available for Chrome and Firefox . The Chrome version can be used in Edge too. Once installed, you should see a new icon in your browser toolbar.
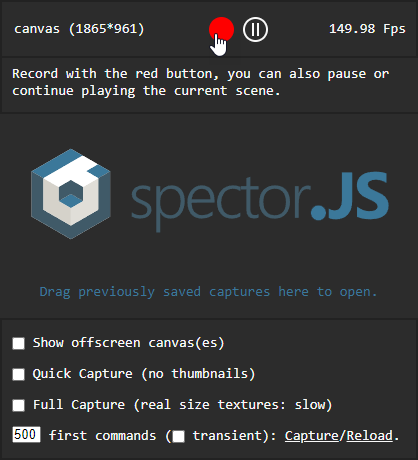
Next, open up your WebXR app in the browser and click the Spector.JS icon to start capturing frames. First your browser page will refresh and Spector.JS activates itself in your page. The icon should turn green when it’s ready to capture.
Now you can move in your game to a point where you want to do a capture. There might a specific place where you notice a performance drop, or where a specific shader is used. When you’re there, click the now green icon and click the capture button.
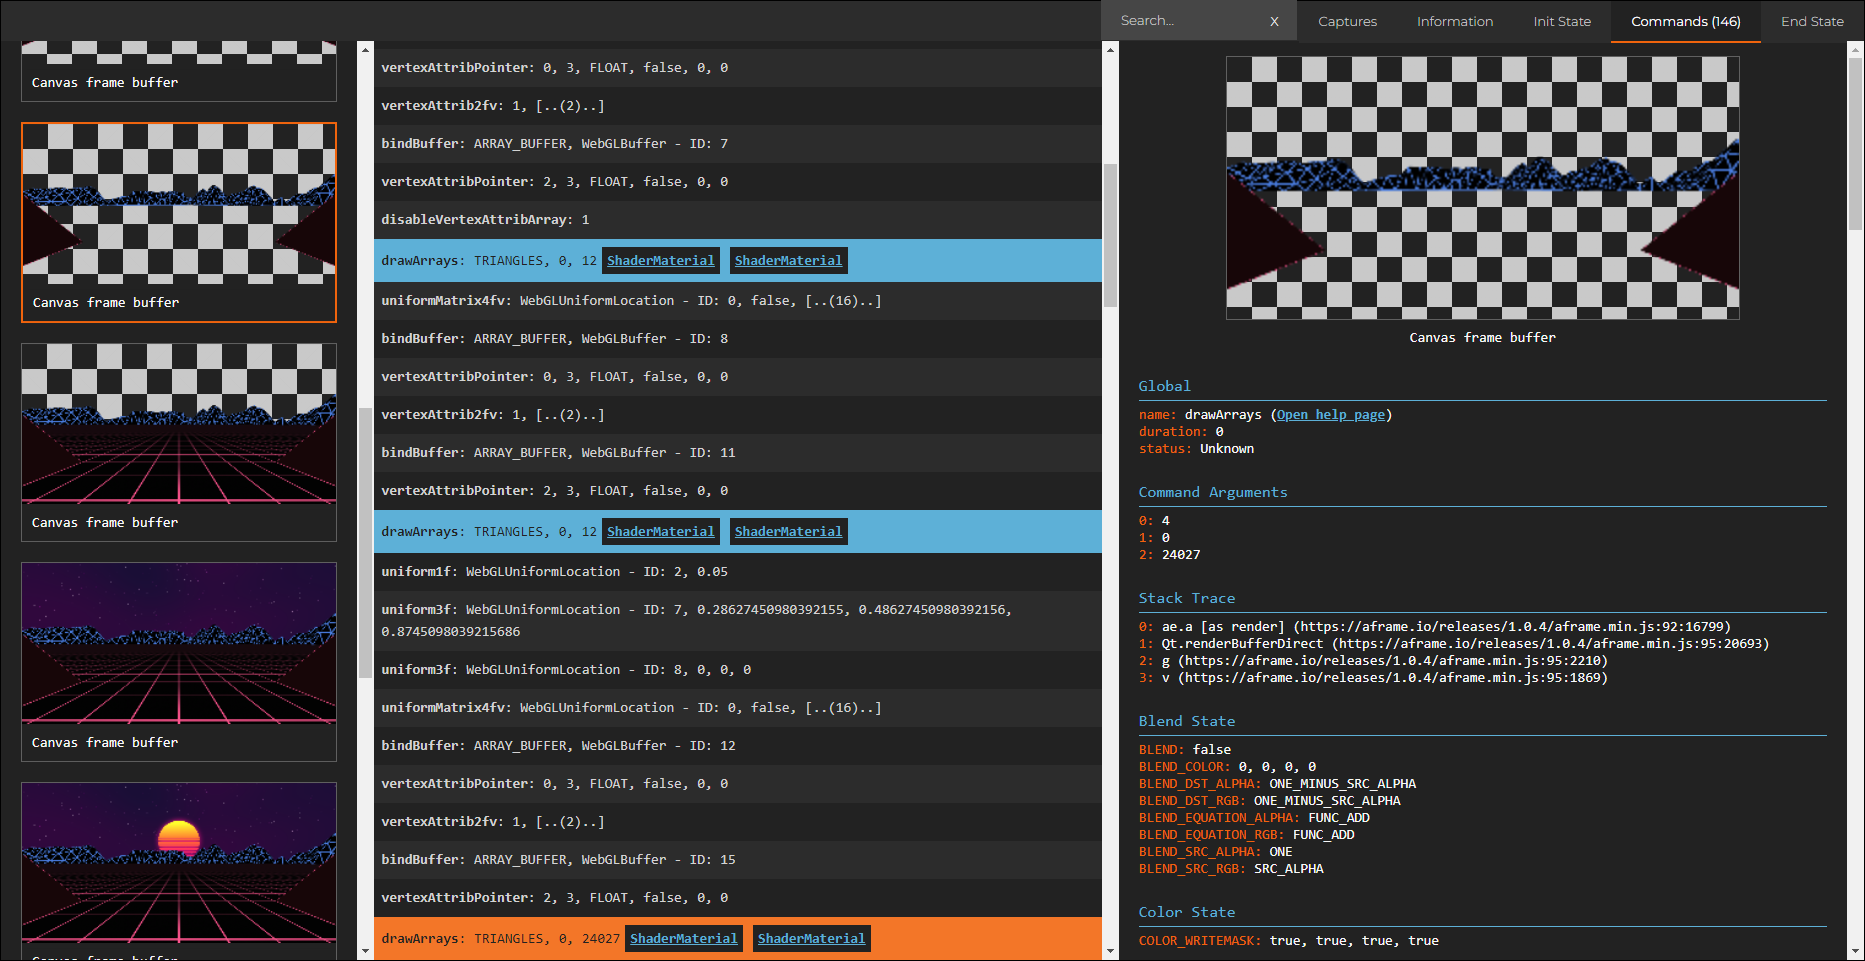
The extension will display the captured frame, allowing you to select a draw call for further analysis.
Analyzing 📊
Spector.JS will display a wealth of information about that frame. This includes: But how do you know what exactly is causing those high frame times? That’s where Spector.JS really shines. By examining the “Captures” tab in the debugger interface, you can see a detailed breakdown of all WebGL commands being executed during each frame.
Look for commands that take an unusually long time to execute or are being called too frequently. These are likely your primary culprits! Some common issues include:
- Overdraw: When objects in your scene are rendered multiple times due to overlapping or transparency.
- Too many draw calls: Each draw call has some overhead, so reducing their number can improve performance.
- Inefficient shaders: Complex or unoptimized shaders can cause significant slowdowns.
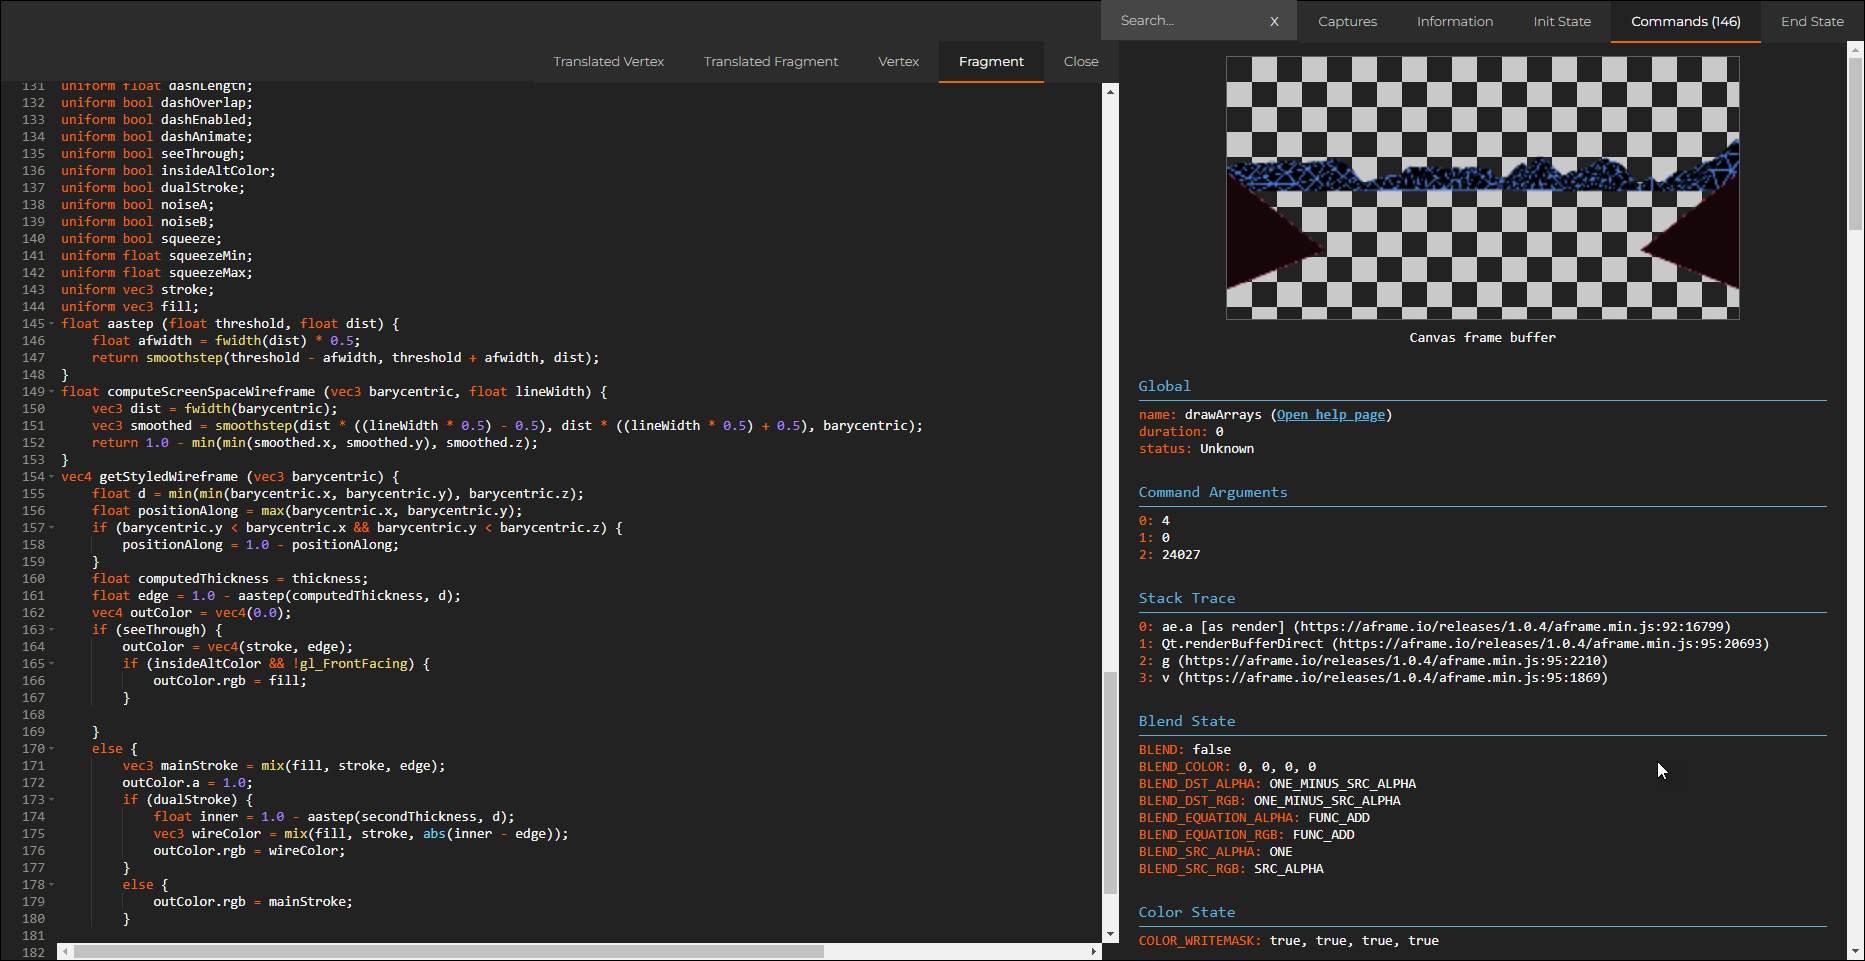
All this information makes it easier for you to spot potential performance issues, such as expensive shader operations or unnecessary state changes. You can dive deeper into the different shaders used. This is invaluable when working with shaders on the web.
From code 🧑💻
If you prefer more custom control or don’t mind adding some extra code to your project.
Let me walk you through the process of including spector.JS as a script. It’s super simple and straightforward.
First off, you can access the library through the CDN by using this URL: https://spectorcdn.babylonjs.com/spector.bundle.js. But if you’re more into hosting your own version, no worries - head to the dist folder in the repo.
For those who installed the library via npm, you’ll find the spector.bundle.js file chilling in the node_module/spectorjs/dist folder.
Next step - referencing! Just pop this tag into your HTML page header:
<script type="text/javascript" src="https://spectorcdn.babylonjs.com/spector.bundle.js"></script>
Now that it’s available in your app, let’s create an inspector by adding this command to your script:
var spector = new SPECTOR.Spector();
Want to display the embedded UI directly on your page? Say no more:
spector.displayUI();
Or if you’d rather launch a capture and use its JSON result, do this:
spector.onCapture.add((capture) => {
    // Do something with capture.
    var myEvent = new CustomEvent("SpectorOnCaptureEvent", { detail: { captureString: JSON.stringify(capture) } });
    document.dispatchEvent(myEvent);
});

var canvas = document.getElementById("renderCanvas");
spector.captureCanvas(canvas);
And lastly, another handy API:
spector.spyCanvases();
This enables complete tracking of GL calls even before capturing, which means you can access texture inputs or memory consumption info. 🕵️♀️
Tips for Optimizing WebXR Performance 💡
Analyzing your WebXR app with Spector.JS can reveal several opportunities for optimization. Once you’ve identified potential bottlenecks, it’s time to fix them. Here are some general tips that might help:
- Reduce polygon count: Simplify models or use level-of-detail techniques to decrease geometry complexity.
- Optimize textures: Use smaller textures or compress them to reduce memory usage and bandwidth consumption.
- Use instancing: If you have many identical objects in your scene, use instancing to render them with fewer draw calls.
- Optimize shaders: Look for opportunities to simplify your shaders or use more efficient techniques.
Wrapping Up
Spector.JS is an invaluable tool for analyzing WebXR performance, helping you identify bottlenecks in your application and providing insights on how to optimize it for a smooth user experience. So go ahead and give it a try – your users will thank you!
Happy Coding! 🚀


