Remote Localhost and Debugging
Localhost and Remote Debugging WebXR from PC to Quest
Hello Coders! 😎 As a developer working with WebXR on the Meta Quest 2, there’s no doubt you’ve faced challenges in tracing down bugs or issues. It can be tough to understand what’s happening on the Quest without proper insight. Don’t worry though, I’m here to share a neat trick that will make your debugging experience a breeze! We’ll be using remote browser debugging from your desktop (Edge or Chrome) to the Quest.
First things first, make sure your Quest is connected to your PC via a USB Cable.
Debugging through the browser (Edge or Chrome)
This is my preferred method since it’s all within the browser. Here’s how you can set it up:
- Open a new tab in your browser and navigate to
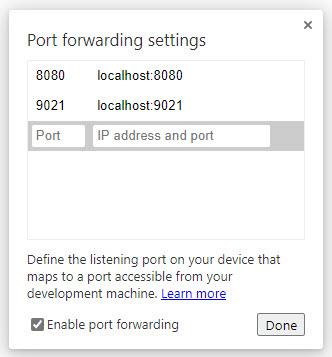
edge://inspectorchrome://inspect, depending on whether you’re using Edge or Chrome. - Set up port forwarding by entering
8080as the port andlocalhost:8080for “IP Address and Port”. - Voila! Now you can simply go to
localhost:8080on your Oculus Quest and view the WebXR app that is running on your PC on that port.
If you want to debug, the list of available pages in the browser is shown on the same page as well! Just click on inspect and start debugging on your PC as you normally would.
Debugging with ADB (Android Debug Bridge)
Alternatively, you can use ADB (Android Debug Bridge) if you’d like to take a different route (more information can be found here ).
- Open a command prompt window.
- Type in
adb reverse tcp:8080 tcp:8080and press Enter.
That’s it! You’re now ready to debug your WebXR apps remotely from your PC to your Oculus Quest .
No matter which method you choose, remote debugging makes identifying and fixing issues way easier. It’s time to say goodbye to those pesky bugs haunting your WebXR projects!
Happy Coding! 🚀


